Blog
Running dbt projects on Snowflake
2 July 2025 | Maciej Tarsa
Discover how to run dbt projects natively on Snowflake using the new Workspaces feature and Git integration. This post explores the benefits, setup process, and current limitations of running dbt directly within Snowflake, including key considerations for teams migrating from other orchestration tools. With dbt Fusion and evolving platform features, now is the perfect time to experiment and prepare for the future of analytics engineering on Snowflake.
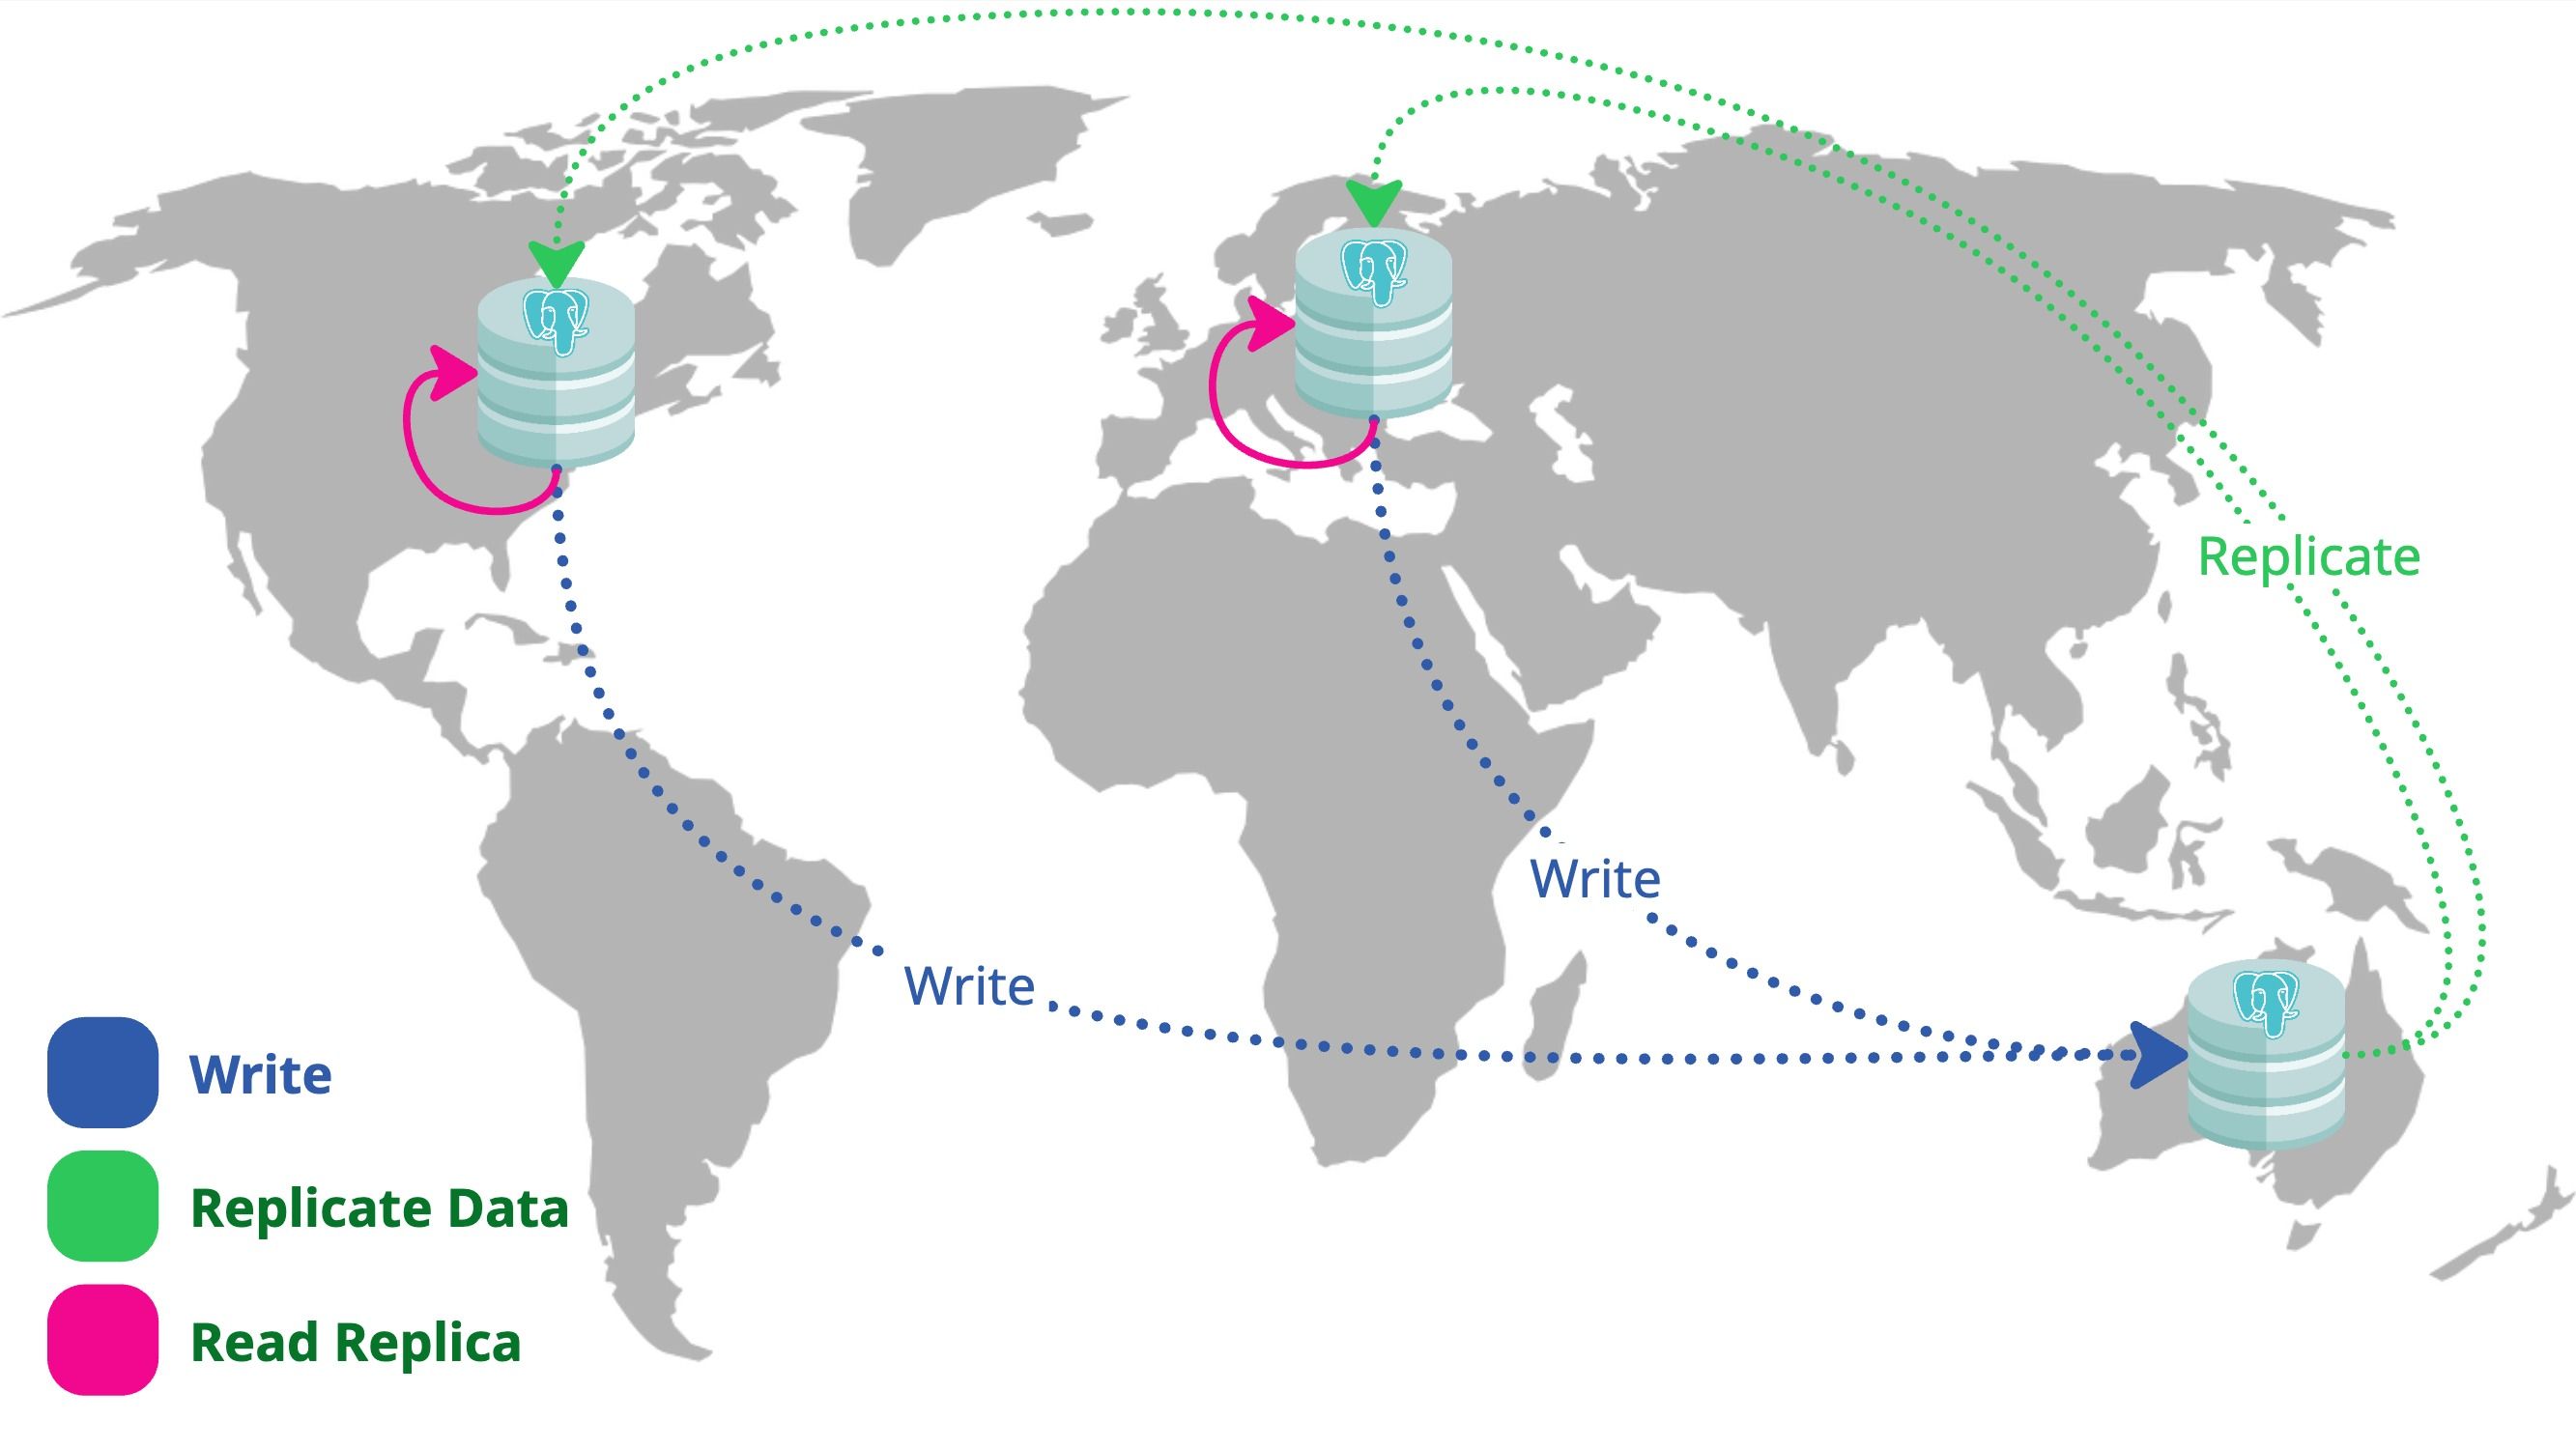
Solving Global Latency With PostgreSQL Logical Replication
8 May 2025 | Quintin Maseyk
As our application gained global traction, performance for users outside Australia began to suffer especially at the database layer. In this post, I share how we solved the challenge by leveraging PostgreSQL Logical Replication to reduce latency for international regions while maintaining a central source of truth. I’ll walk through our decision-making process, implementation steps, and the lessons we learned scaling a global architecture.
16 April 2025 | Maciej Tarsa
Tried and tested methods to reduce your Snowflake spending
Speak & It Shall Be Done: Building a Voice Assistant That Actually Works
26 March 2025 | Jesse Millman
A deep dive on setting up Voice Enabled AI workflows with Eleven Labs, n8n, and OpenAI.
How Databricks Apps Are Changing Our Relationship With Information
12 March 2025 | Jesse Millman
This blog post explores the shift from dashboards to interactive applications in the Databricks ecosystem, using a LinkedIn content optimization app as a concrete example of how these new tools transform business workflows and create value.
Chrome-ing to Success: Automate CI/CD for Web Extensions
6 March 2025 | Tui Warihana
Web extension development comes with its own set of challenges—ambiguous documentation, browser quirks, and the risk of deployment headaches. A solid CI/CD pipeline can take the guesswork out of releases, ensuring smooth updates and secure hosting. In this guide, I’ll walk you through automating the process so you can spend less time troubleshooting and more time building.
Securing Load Balancers: A Tale of Two CloudFront Approaches
10 February 2025 | Jesse Millman
As web applications grow in complexity, securing communication between CloudFront and origin servers remains a critical concern. Today, we explore two approaches to this challenge: custom header validation vs Amazon's newly announced CloudFront VPC origins feature. We'll see how this new approach dramatically simplifies origin security while improving your infrastructure's security posture.
A Grad's Review of re:Invent 2024
30 January 2025 | Sophie Giraudo
My 3 top highlights from attending re:Invent 2024 thanks to the AWS All Builders Welcome Grant.
Aurora DSQL: The Future of Serverless Relational Data
22 January 2025 | Jesse Millman
Amazon's newest database offering, Aurora DSQL, makes it easier than ever to build highly performant global applications that need consistent data everywhere. Unlike previous solutions that required complex trade offs between performance and reliability, DSQL lets you write and read data from any location while keeping everything in sync automatically.
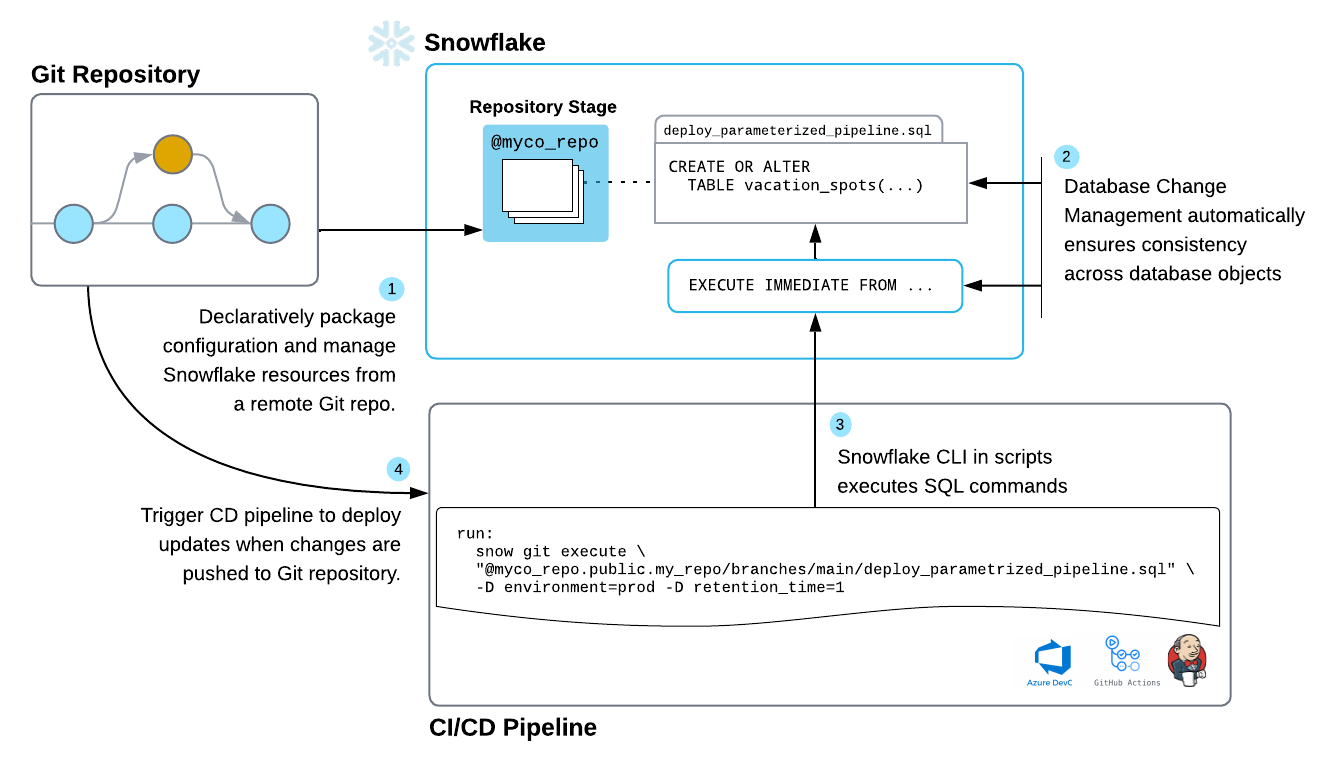
Snowflake DevOps - first impressions and comparison with schemachange
13 January 2025 | Maciej Tarsa
An evaluation of Snowflake DevOps tools for managing lifecycle of Snowflake resources compared with schemachange